2022-12-05
The capacity of a lithium battery determines the time of use at the customer's terminal, and the calculation and display of SOC is related to the customer's mastery of the state of the lithium battery. After all, Li-ion battery is a chemical energy source and is susceptible to many peripheral factors, so how to accurately calculate SOC has always been a difficult task in the Li-ion battery industry.
Let SES Power, with nearly 20 years of experience in the Li-ion battery industry, briefly introduce you to the various aspects of SOC.
A: Basic terms and concepts
a.1 State-Of-Charge (SOC)
State-Of-Charge can be defined as the state of the available electrical energy in a battery and is usually expressed as a percentage.
Since the available electrical energy varies depending on the charge/discharge current, temperature and ageing phenomena, two definitions of state-of-charge are distinguished: Absolute State-Of-Charge (ASOC) and Relative State-Of-Charge (RSOC).
Usually the Relative State-Of-Charge range is 0% - 100%, while the battery is 100% when fully charged and 0% when fully discharged. The absolute state-of-charge is a reference value that is calculated when the battery is manufactured and based on a fixed capacity value for which it was designed.
A new fully charged battery has an absolute state of charge of 100%; an aged battery, even if fully charged, will not reach 100% in different charge and discharge conditions.
The graph below shows the relationship between voltage and battery capacity at different discharge rates. The higher the discharge rate, the lower the capacity of the battery. At lower temperatures, the battery capacity is also reduced.
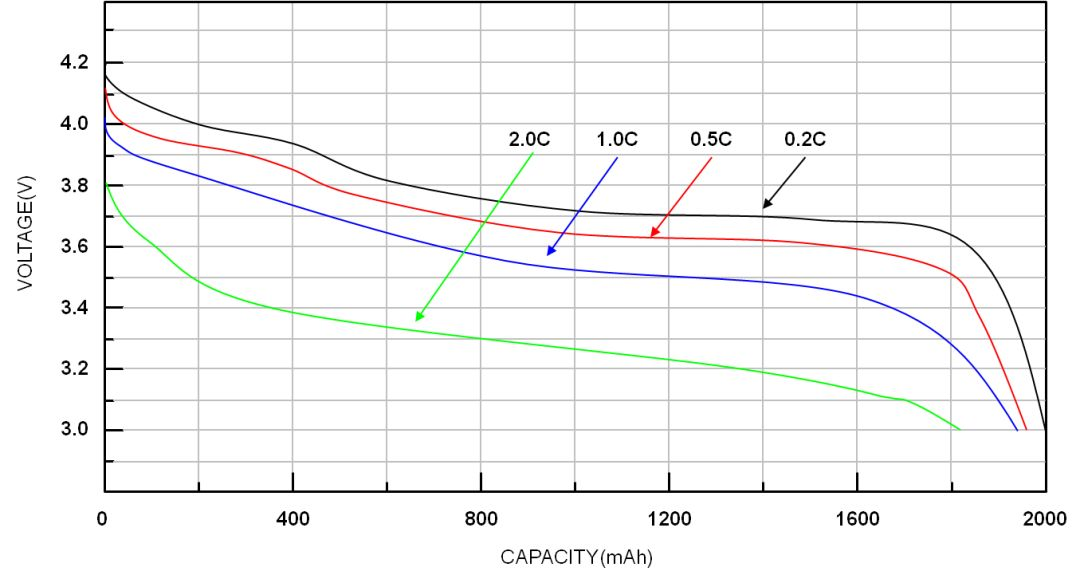
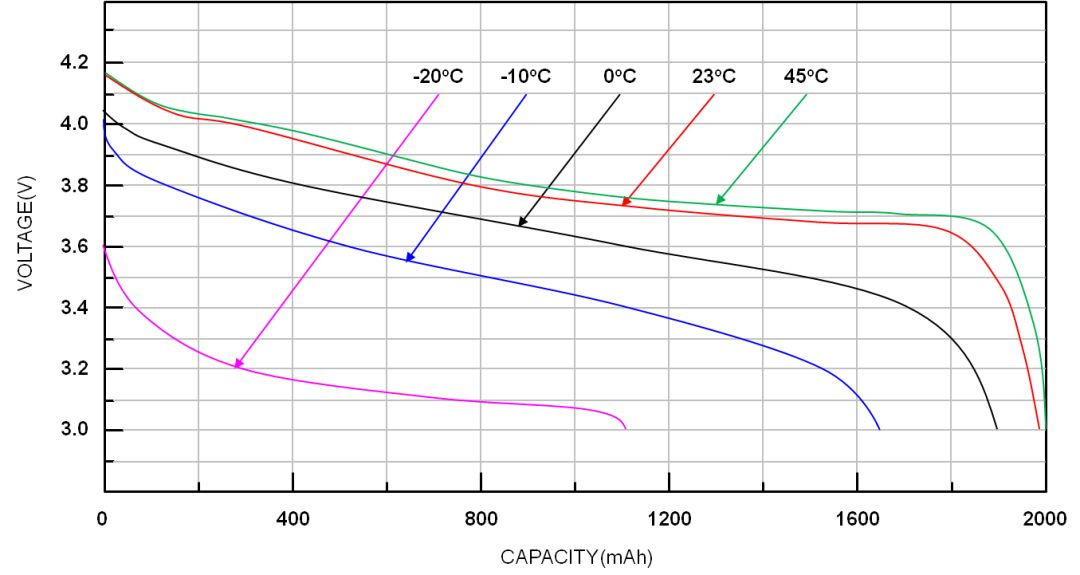
Figure 1. Relationship between voltage and capacity at different discharge rates and temperatures
a.2 Max Charging Voltage
The maximum charging voltage is related to the chemical composition and characteristics of the battery.
The charging voltage of lithium batteries is usually 4.2V and 4.35V, but the value may vary depending on the cathode and anode materials.
a.3 Fully Charged
A battery is considered fully charged when the difference between the battery voltage and the maximum charge voltage is less than 100mV and the charge current is reduced to C/10.
The conditions for full charging vary depending on the characteristics of the battery.
The graph below shows a typical Li-ion battery charging characteristic curve. When the battery voltage is equal to the maximum charge voltage and the charge current is reduced to C/10, the battery is considered to be fully charged.
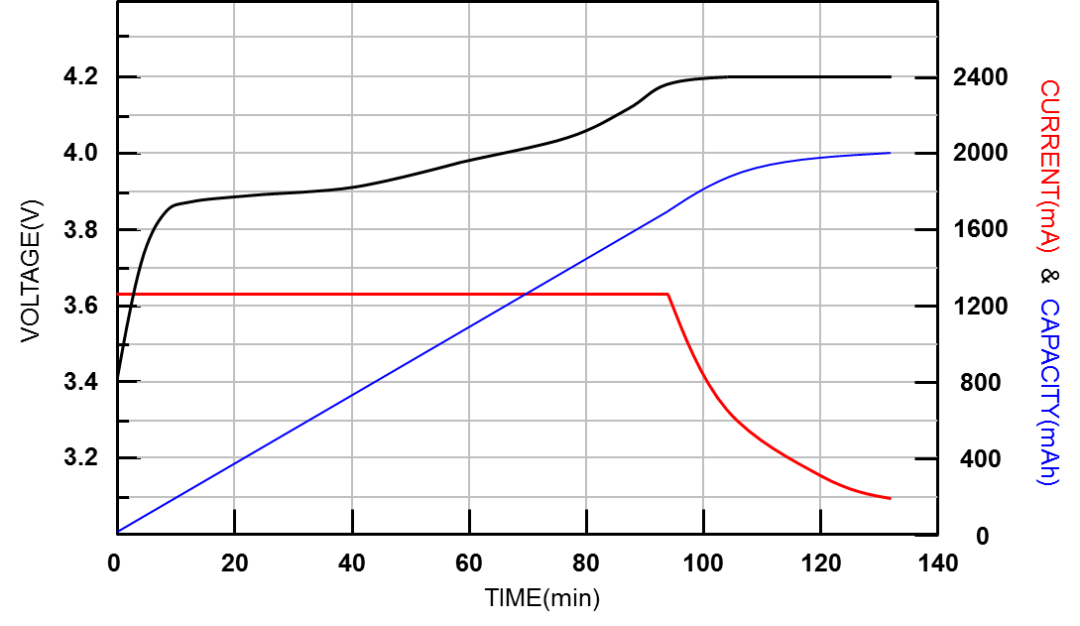
Figure 2. Li-ion battery charging characteristics curve
a.4 Minimum Discharging Voltage (Mini Discharging Voltage)
The minimum discharge voltage can be defined by the cut-off discharge voltage, which is usually the voltage when the charge state is 0%.
This voltage is not a fixed value, but varies with load, temperature, ageing or other factors.
a.5 Fully Discharge
A battery is said to be fully discharged when its voltage is less than or equal to the minimum discharge voltage.
a.6 Charge/Discharge Rate (C-Rate)
The charge/discharge rate is an indication of the charge/discharge current in relation to the capacity of the battery. For example, if 1C is used to discharge the battery for one hour, ideally the battery will be fully discharged.
Different charge/discharge rates will result in different usable capacities. Generally, the higher the charge/discharge rate, the lower the usable capacity.
a.7 Cycle life
The number of cycles is the number of times a battery has been fully charged and discharged and can be estimated from the actual discharge capacity to the design capacity.
Whenever the accumulated discharge capacity is equal to the design capacity, the number of cycles is once. Typically after 500 charge/discharge cycles, the capacity of a fully charged battery will drop by 10% to 20%.
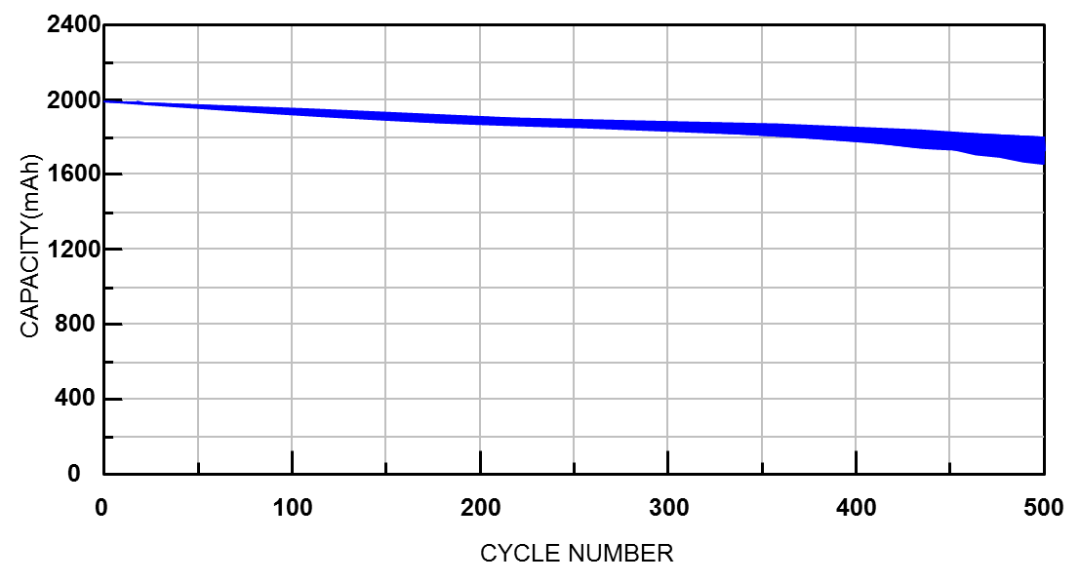
Figure 3. Relationship between number of cycles and battery capacity
a.8 Self-Discharge
The self-discharge of all batteries increases as the temperature rises. Self-discharge is not basically a manufacturing defect, but a characteristic of the battery itself.
However, improper handling during the manufacturing process can also cause an increase in self-discharge. Typically, the self-discharge rate doubles with every 10°C increase in battery temperature. The self-discharge rate of lithium-ion batteries is about 1-2% per month, while the self-discharge rate of all types of nickel-based batteries is 10-15% per month.
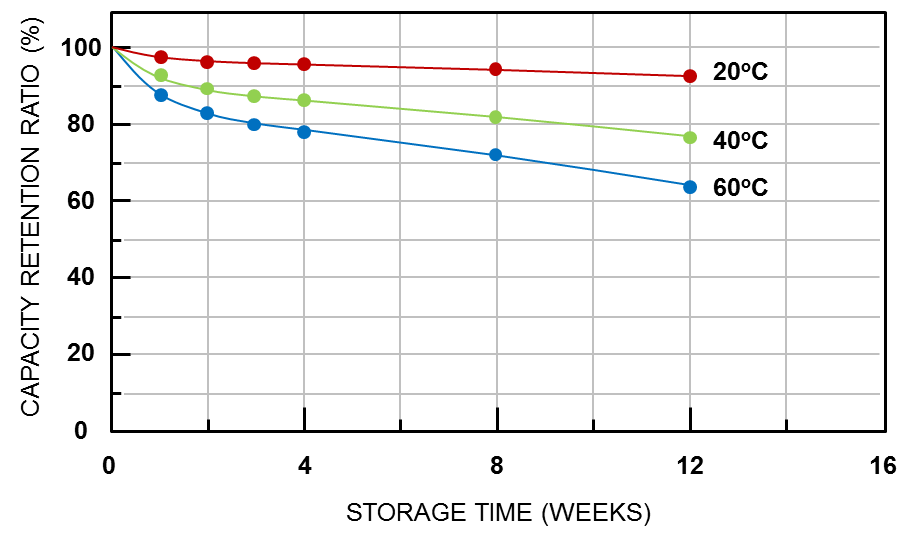
Figure 4: Self-discharge rate of lithium batteries at different temperatures
B: Brief description of the battery charge meter
b.1 Brief description of power meter function
Battery management can be considered as a part of power management. In battery management, the charge meter is responsible for estimating the battery capacity. Its basic function is to monitor voltage, charge/discharge current and battery temperature, and to estimate the state of charge (SOC) and the full charge capacity (FCC) of the battery.
There are two typical methods of estimating the state of charge of a battery: the open circuit voltage method (OCV) and the coulometric method. Another method is the dynamic voltage algorithm devised by RICHTEK.
b.2 The open circuit voltage method
The open-circuit voltage method is a relatively easy method to implement and can be obtained by checking the meter against the open-circuit voltage corresponding to the state of charge. The open circuit voltage is based on the assumption that the battery is resting for more than 30 minutes.
The battery voltage curve will vary depending on the load, temperature and ageing of the battery. Therefore a fixed open-circuit voltmeter is not fully representative of the state of charge and cannot be relied upon alone to estimate the state of charge. In other words, if the state of charge is estimated only by checking the meter, the error will be large.
The diagram below shows that for the same battery voltage under charging and discharging respectively, the state of charge obtained by the open circuit voltage method varies greatly.
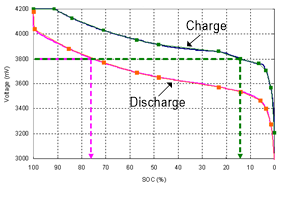
Figure 5: Battery voltage under charging and discharging conditions
As can be seen from the graph below, the difference in charge state under different loads during discharge is also very large. Therefore, basically, the open circuit voltage method is only suitable for systems that require low accuracy of the charge state, such as lead-acid batteries for cars or uninterruptible power supplies.
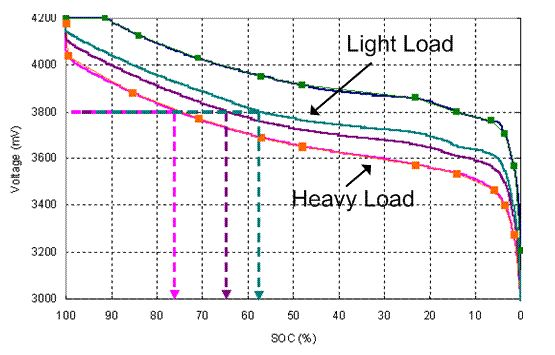
Figure 6: Battery voltage under different loads during discharge
b.3 Coulometric method
Coulometry operates by connecting a sense resistor to the charge/discharge path of the battery, the ADC measures the voltage across the sense resistor and converts it to the current value of the battery being charged or discharged. A real time counter (RTC) provides the means to integrate this current value against time to find out how many coulombs have flowed.
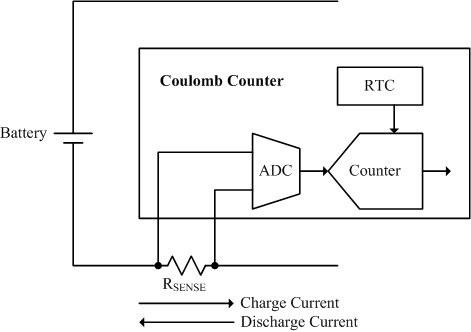
Figure 7. Basic working of coulomb metering
Coulomb metering allows the precise calculation of the charge state in real time during charging or discharging. By means of a charge coulomb counter and a discharge coulomb counter it is possible to calculate the residual capacity (RM) and the full charge capacity (FCC). The remaining capacity (RM) and the full charge capacity (FCC) can also be used to calculate the state of charge, i.e. (SOC = RM / FCC). In addition, it is possible to predict the remaining time, e.g. the power depletion (TTE) and the power full (TTF).
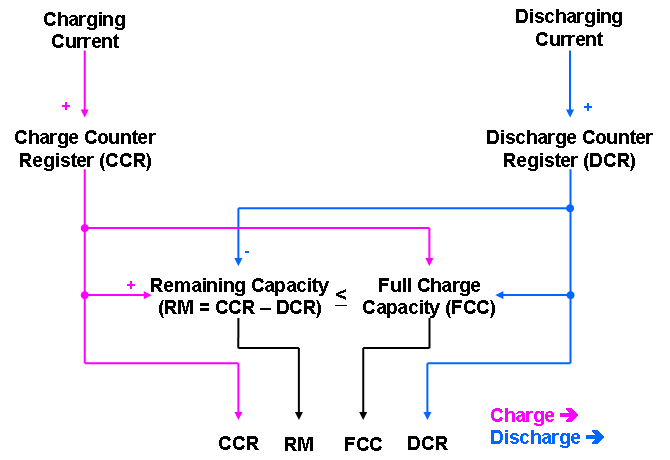
Figure 8. Calculation formula for Coulomb metering
There are two main factors that cause deviations in the accuracy of the Coulomb metering method. The first is the accumulation of offset errors in the current sensing and ADC measurements. Although the error in this measurement is fairly small with current technology, it will increase over time if there is no good way to eliminate it. The graph below shows that in practice, if no correction is made over time, the accumulated error is unbounded.
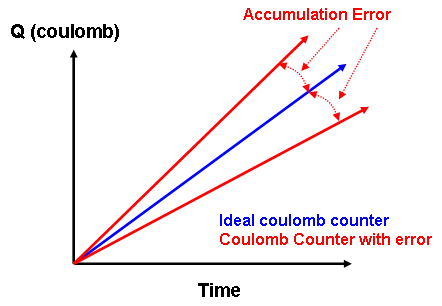
Figure 9. Cumulative error in Coulomb metrology
To eliminate the cumulative error, there are three possible time points that can be used in normal battery operation: end of charge (EOC), end of discharge (EOD) and rest (Relax). The end of charge condition is reached when the battery is fully charged and the state of charge (SOC) should be 100%. The End of Discharge condition indicates that the battery is fully discharged and the SOC should be 0%; it can be an absolute voltage value or vary with load. When the rest state is reached, the battery is neither charged nor discharged and remains in this state for a long time. If the user wishes to use the rest state for error correction in coulometric measurement, an open-circuit voltmeter must be used in this case. The diagram below shows that the error in the charge state can be corrected for in the above state.

Figure X. Conditions for eliminating cumulative coulometric errors
The second major factor contributing to deviations in the accuracy of coulometry is the Full Charge Capacity (FCC) error, which is caused by the difference between the design capacity value of the battery and the true fully charged capacity of the battery.
The Full Charge Capacity (FCC) is affected by temperature, ageing, load etc. Therefore, the method of relearning and compensating for the FCC is critical to coulometry. The graph below shows the trend phenomenon of the state of charge error when the full charge capacity is overestimated and underestimated.
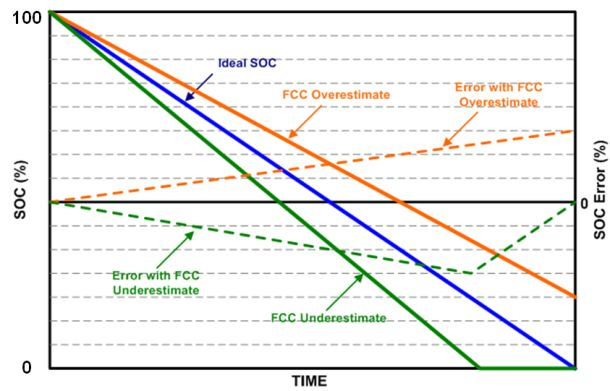
Figure 11. Trend of error when fully charged capacity is overestimated and underestimated
b.4 Dynamic voltage algorithm galvanometer
The dynamic voltage algorithm meter calculates the state of charge of a lithium battery based on the battery voltage alone. This method estimates the incremental or decremental state of charge based on the difference between the battery voltage and the open circuit voltage of the battery.
The dynamic voltage information can effectively simulate the behaviour of the Li-ion battery and thus determine the state of charge SOC (%), but this method does not estimate the battery capacity value (mAh).
It is calculated based on the dynamic difference between the cell voltage and the open circuit voltage, lending itself to the use of an iterative algorithm to calculate each increase or decrease in the state of charge to estimate the state of charge.
In contrast to the coulometric solution, the dynamic voltage algorithm meter does not accumulate errors over time and current. Coulometric meters are often inaccurate in estimating the state of charge due to current sensing errors and battery self-discharge. Even if the current sensing error is very small, the Coulomb counter will continue to accumulate errors which can only be removed when fully charged or fully discharged.
The dynamic voltage algorithm meter estimates the state of charge of the battery from the voltage information only; it does not accumulate errors because it does not estimate from the current information of the battery. To improve the accuracy of the state of charge, the dynamic voltage algorithm requires an optimised algorithm with parameters that can be adjusted by the actual battery voltage profile under fully charged and fully discharged conditions using the actual device.
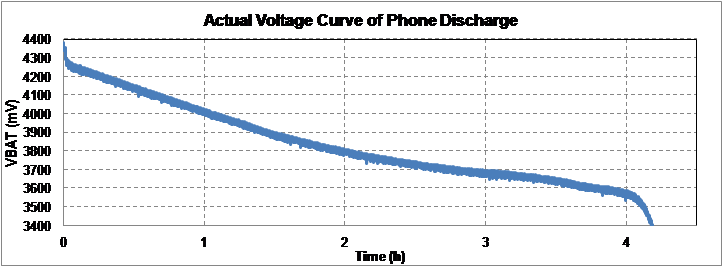
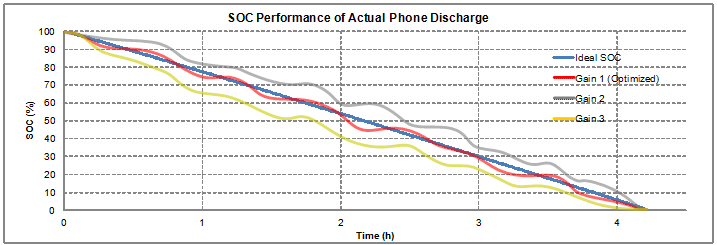
Figure 12. Performance of the dynamic voltage algorithm power meter and gain optimisation
Below is the performance of the dynamic voltage algorithm for the charge state under different discharge rate conditions. As can be seen from the graph, it has good accuracy in the charge state. The overall error in the charge state of this method is less than 3%, regardless of the discharge conditions of C/2, C/4, C/7 and C/10.
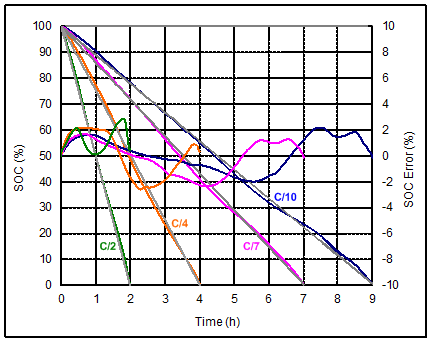
Figure 13: Performance of the dynamic voltage algorithm for different discharge rates
The graph below shows the performance of the state of charge under short charge and short discharge conditions. The error in the charge state is still small and the maximum error is only 3%.
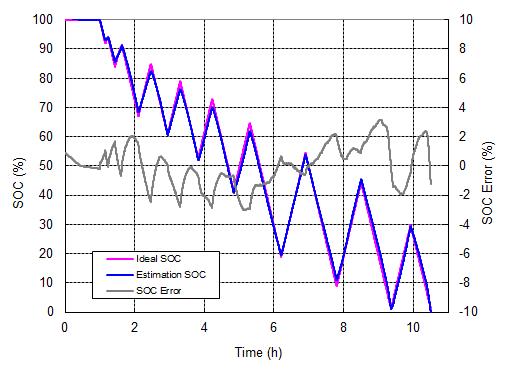
Figure 14: Performance of the dynamic voltage algorithm for the charge state in the case of a short charge and short discharge of the battery
Compared to coulometric meters, which are usually inaccurate due to current sensing errors and battery self-discharge, the dynamic voltage algorithm does not accumulate errors over time and current, which is a major advantage.
Because there is no charge/discharge current information, the dynamic voltage algorithm is less accurate in the short term and has a slower response time. In addition, it cannot estimate the full charge capacity. However, it performs well in terms of long term accuracy, as the battery voltage will eventually directly reflect its state of charge.
C:Summary
There is no perfect individual way to calculate the SOC of a Li-ion battery, after all, there are too many factors that influence it. The common practice now is to use multiple methods together, with a certain amount of correction through the upper layer of software, which requires a very high degree of consistency in the initial state and consistency in the use of the lithium battery. So the industry is gradually joining AI to intelligently sense and correct the SOC of lithium batteries.
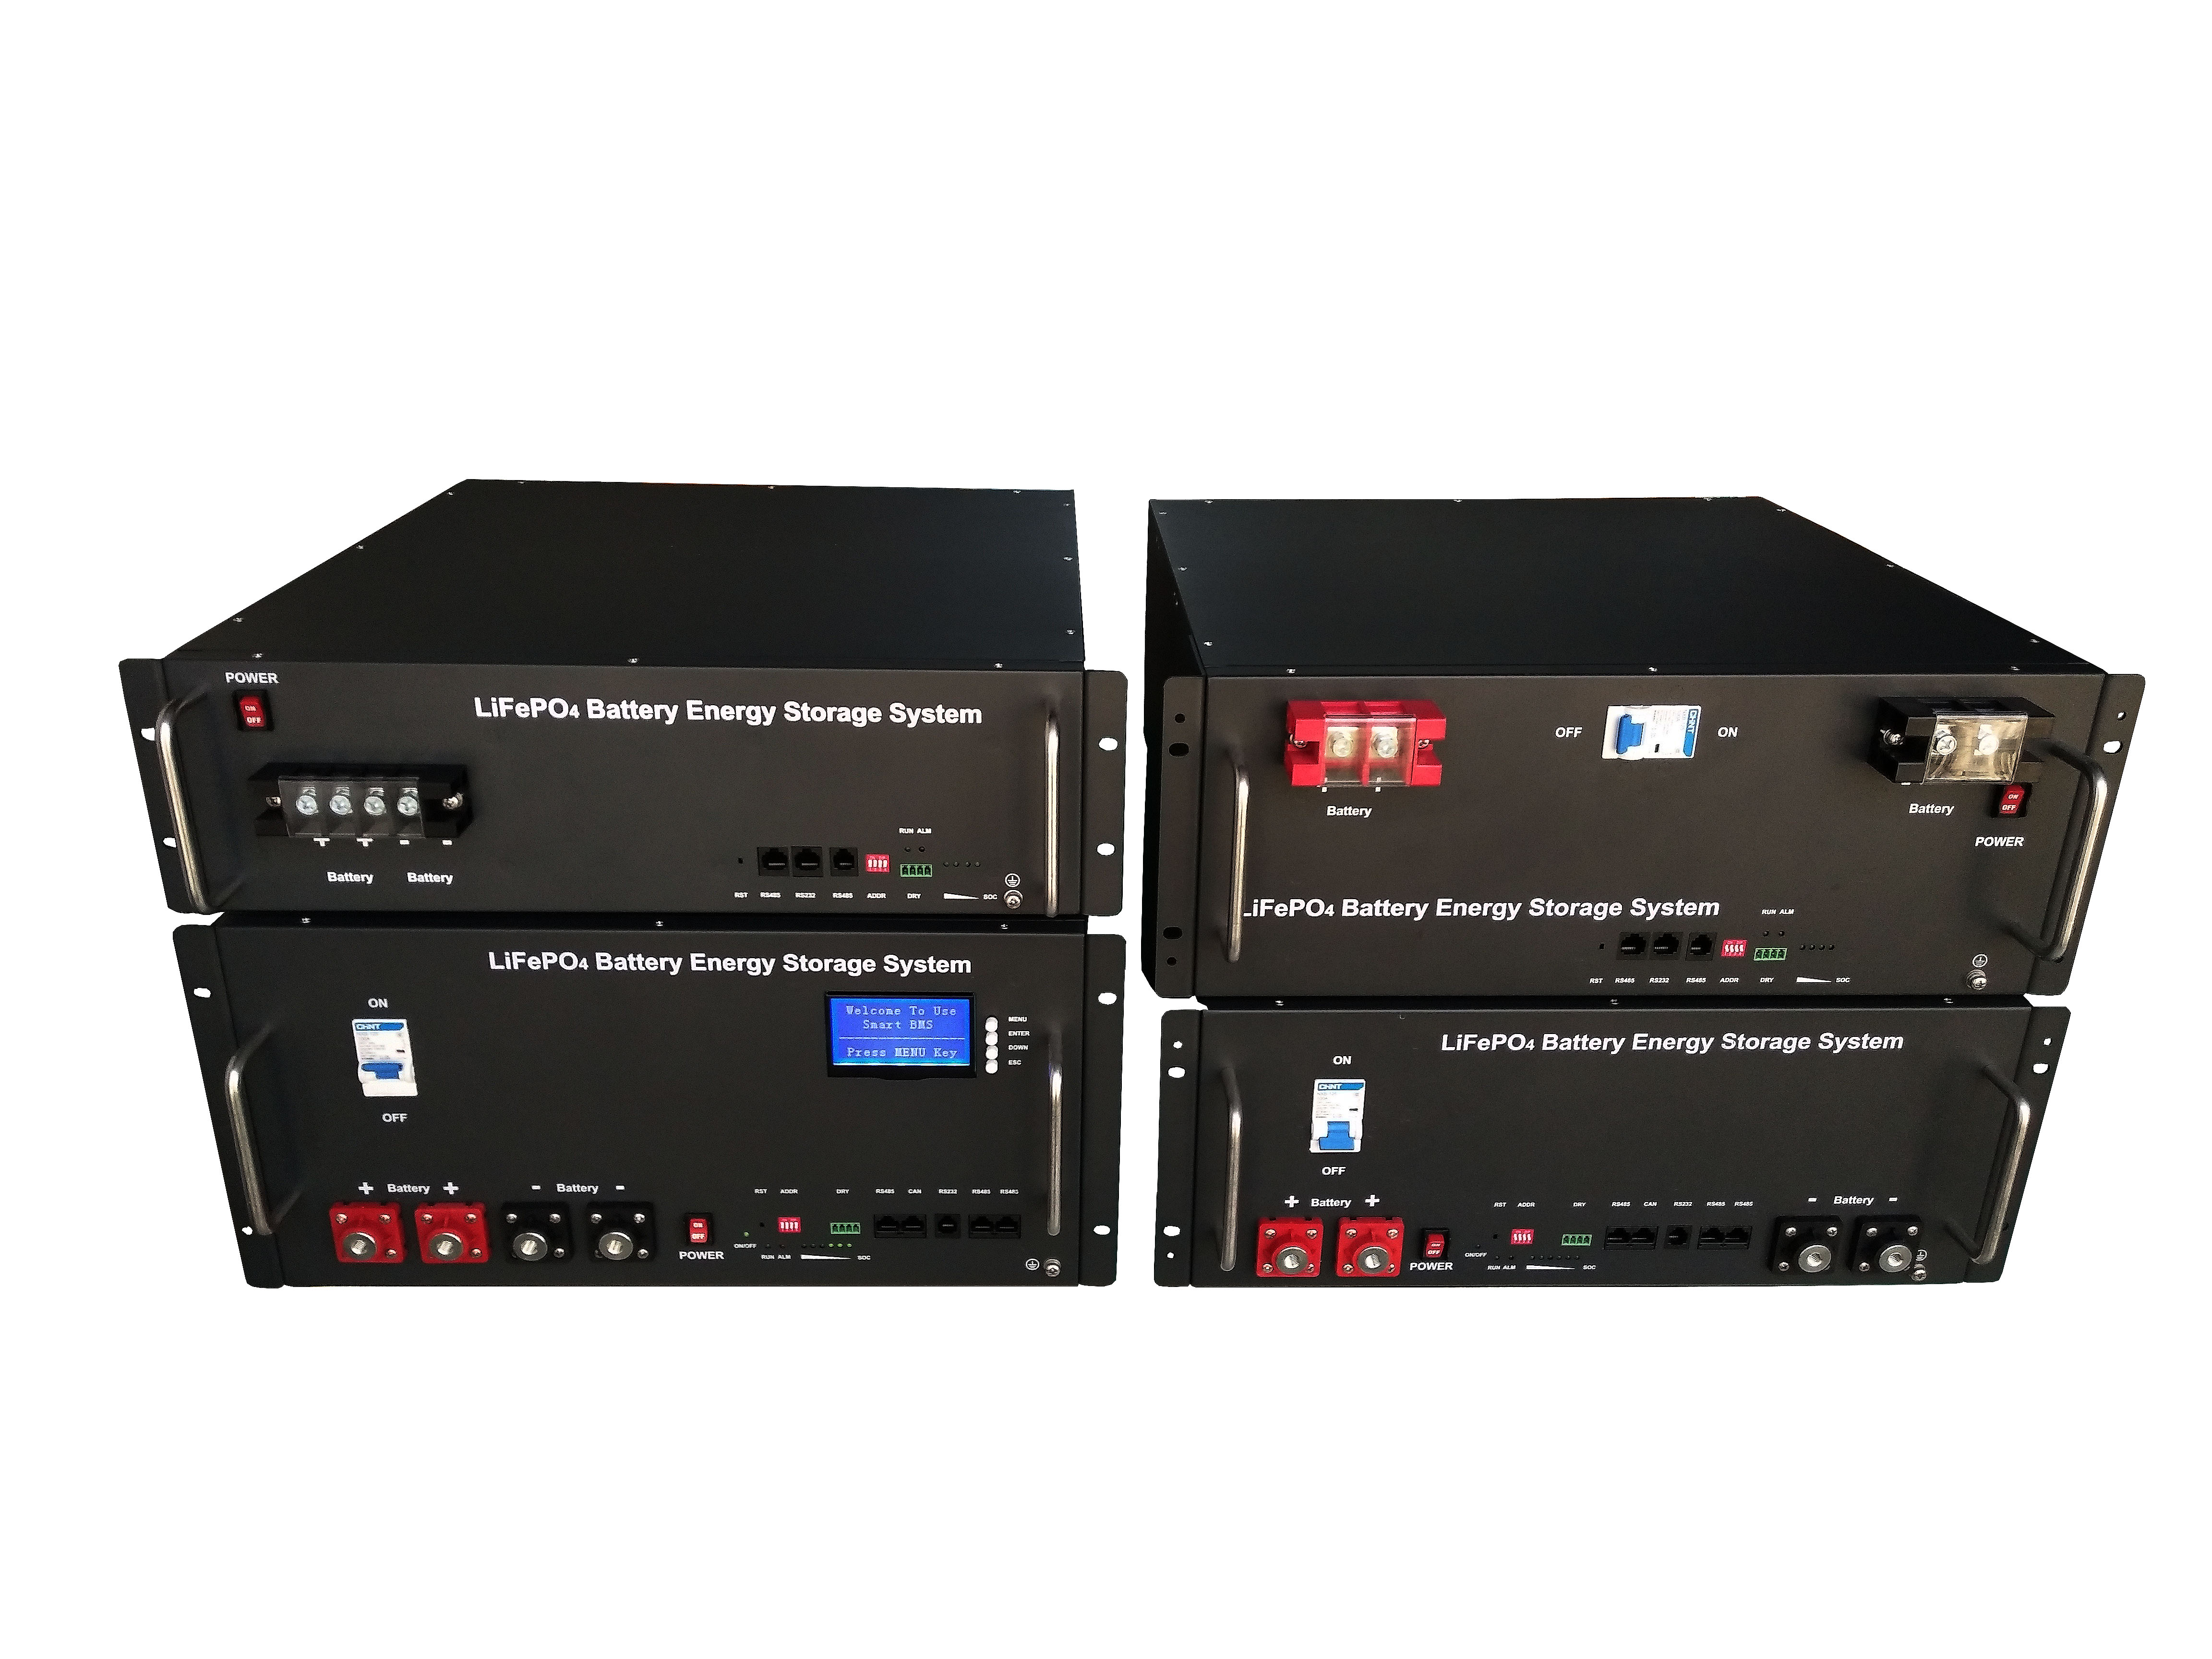
As a manufacturer with nearly 20 years of experience in the lithium battery industry, SES Power has been focusing on the demand for lithium battery energy storage systems for a long time, and we have introduced corresponding products for different application scenarios to achieve the best price/performance ratio. V100Ah, etc.), high-current (2000A) starter lithium batteries, UPS high-voltage lithium battery systems (up to 860V), 3Kw~20Kw off-grid, grid-connected, islanded lithium battery storage systems, wall-mounted home energy storage systems 48V100Ah, 48V200Ah, stacked energy storage systems (51.2V100Ah for a single unit, up to 15 stacks) etc.
If you have any questions about lithium batteries, you are welcome to contact us.

SELENE

HỆ THỐNG NĂNG LƯỢNG MẶT TRỜI D

Ổ CẮM ĐIỆN POWERCUBE